Europe Climate Risk

Your park is built.
What else can your site do?

Continued operation after subsidies end, repowering or PV on your existing grid connection: for sites across the EU, we calculate what each option brings over the next 20 years. Hourly site weather and climate scenarios are built in; in Germany, grid conditions at the substation too.

84%

of 448 wind turbines fall short of their own yield estimate after five years.

Yesterday’s estimate is not today’s yield

For these turbines, Germany’s market master data register (MaStR) lists both values: the registered yield estimate and the measured site quality after five years of operation, each as a share of the reference yield. The median measured value is 7.9 percentage points lower. Anyone deciding on continued operation, repowering or a new power contract should therefore plan with what the site actually delivers.

Own analysis of public MaStR data, as of August 2026: turbines commissioned up to 2021 with both values reported and above zero.

What we calculate for your site

Keep running or repower?

When feed-in support ends (in Germany, the EEG tariff), we compare your current turbines with modern ones at the same site, 20 years ahead, with P50 and P90 for direct marketing or a PPA. Whether repowering pays off depends on your costs and prices. We calculate that together.
PV on your existing grid connection

A wind park rarely uses its grid connection to the full. We calculate hour by hour how much PV fits, how often the connection is then full and how much energy would be curtailed. Available as an analysis on request.

Where does the yield go?

Is your park producing less than expected? With your meter data, we separate what is due to shutdowns, the site and the weather. We do this in a pilot with your operating data.

Every figure includes 20 years of hourly site weather and the EURO-CORDEX climate scenarios. Climate shifts yield slowly; weather varies more from year to year. Both are built in. P50/P90: the energy reached or exceeded in 5 or 9 out of 10 years. Results are planning estimates, not a certified yield assessment.

Book a conversation

What we model

Wind, solar, battery storage and grid connections sit in one portfolio, down to the individual component, for sites across the EU. Valuation uses your PPA or day-ahead price, and in Germany your EEG tariff too.

Wind

Yield per turbine from hourly site weather and its power curve, about 900 turbine models in the catalogue. Result: loss overview and P90/P50/P10.

Solar

The pvlib model chain uses hourly irradiance and temperature: soiling, temperature losses, inverter clipping and degradation.

Battery storage

Thermal derating and cycle ageing in the risk and measures register, with measures valued in euros. No separate yield model.

Grid

Shared grid connections and transformer derating in the portfolio. In Germany: modelled congestion per substation from 100 kV and, on request, headroom for flexible connections.

More for grid operators

Coverage: yield, weather and climate scenarios for more than 30 European countries. Germany only: MaStR import, substations and connection points, congestion, flexible-connection headroom, regional flood zones, snow load and EEG tariffs.

The platform

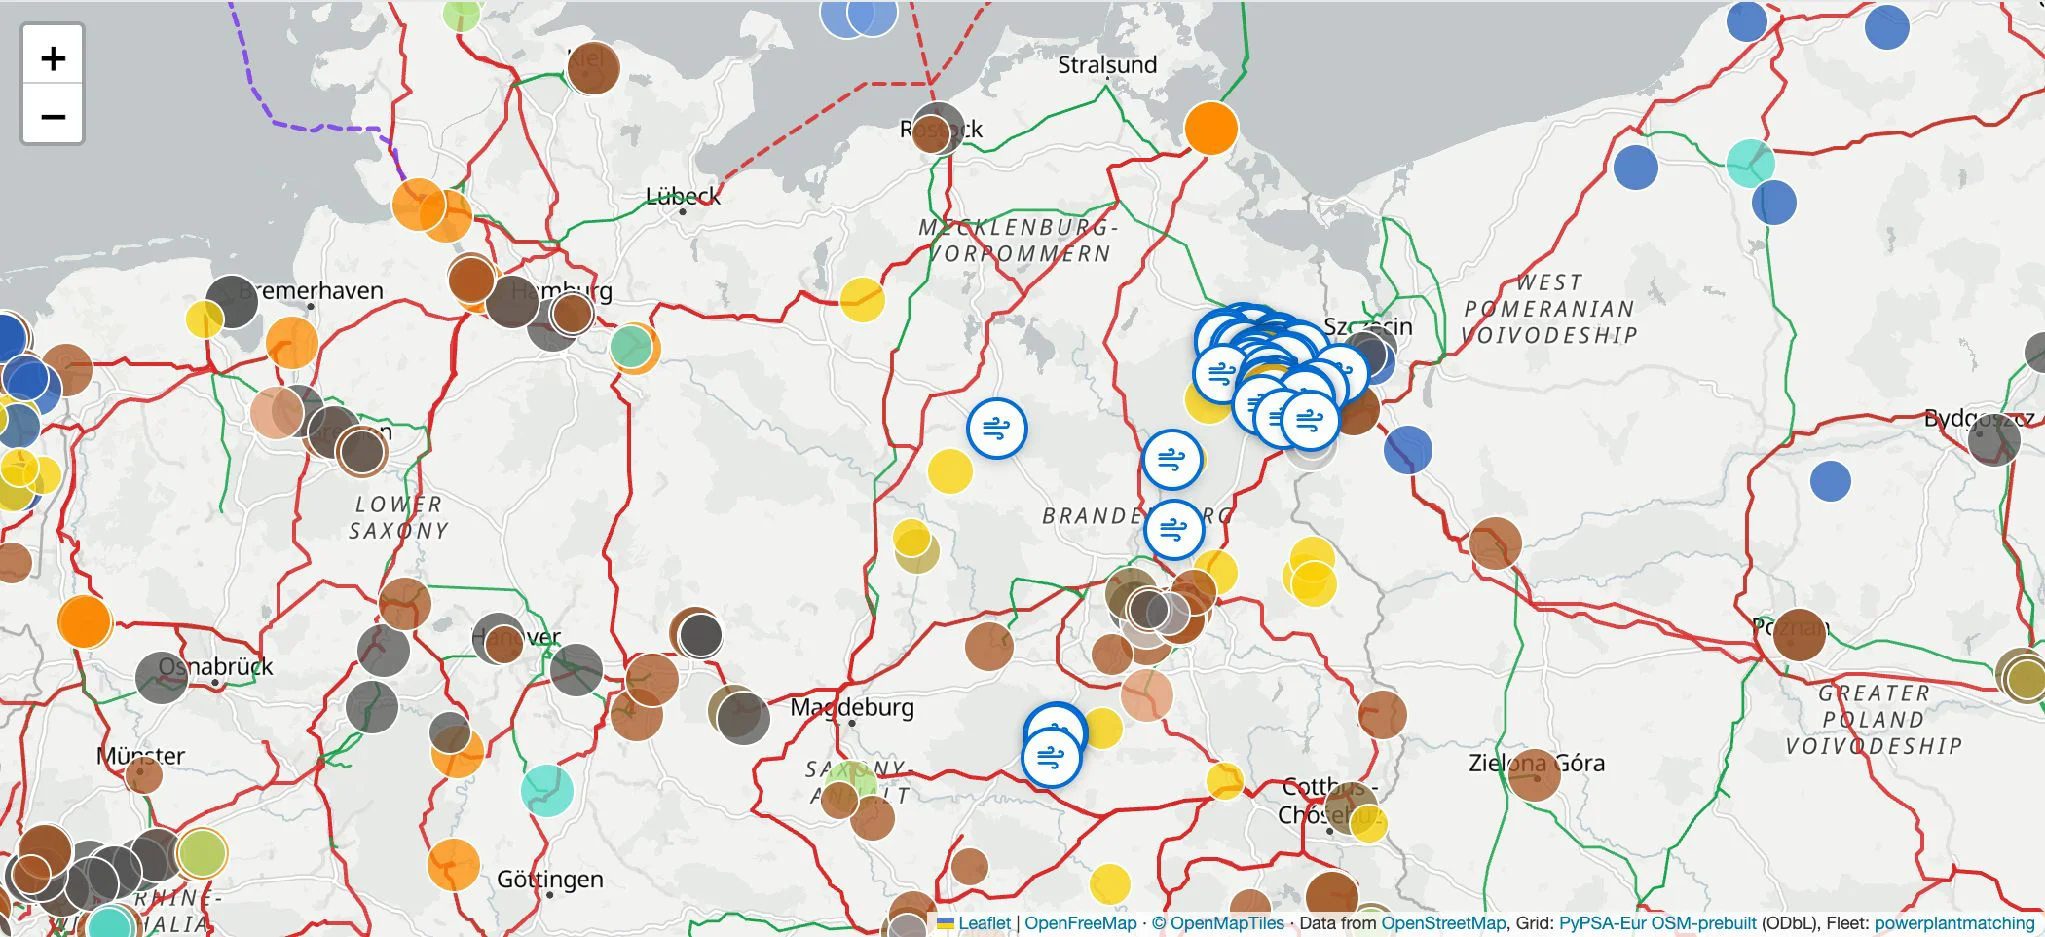
Your assets, substations and modelled grid congestion on one map, built from weather, climate and registry data.

EnviroTrust asset map showing an illustrative energy portfolio and transmission grid

Who it’s for

Operators, municipal utilities and community wind

End of subsidies, repowering, PV on the grid connection or a yield gap: we calculate the options for your site, 20 years ahead, anywhere in the EU.

Book a conversation

Grid operators and project developers

Where is congestion, and how much new wind or PV fits at a substation, today and in 20 years?

More for grid operators

Banks and project-finance lenders

An independent second view on yield and climate risk of the parks you finance: screening, not a replacement for a yield assessment.

Book a conversation

What happens in the first conversation

  1. 01

    When booking, name a park or MaStR registry number, or send an asset list in advance.

  2. 02

    In the call, we show you the options for that site with numbers: continued operation, repowering, PV on the grid connection.

  3. 03

    You decide whether we refine the calculation with your operating data in a pilot.

Let’s talk about your site

30 minutes, online. When booking, name a park, a MaStR registry number or a substation, or send an asset list in advance. In the call, we show you with numbers which options exist there. Afterwards you decide whether a pilot makes sense.