The EnviroTrust energy platform
From site to decision.
Wind and solar yield from hourly site weather, 20 years ahead with climate scenarios. On that basis we compare continued operation, repowering and retrofits at your tariff. Batteries and grid connections are assessed through the risk and measures register, not a separate yield model.
What does the site deliver today and in 20 years?
Which option pays off: continued operation, repowering or retrofit?
What does that mean in euros at your tariff?
One portfolio. Traceable down to the component.
For operators, municipal utilities and community wind, for grid operators and project developers. Technical and financial assessments use the same transparent data basis.
The plant → asset → component hierarchy keeps specifications, risks and measures connected. It shows which assumption affects an individual turbine, an inverter or the shared grid connection.
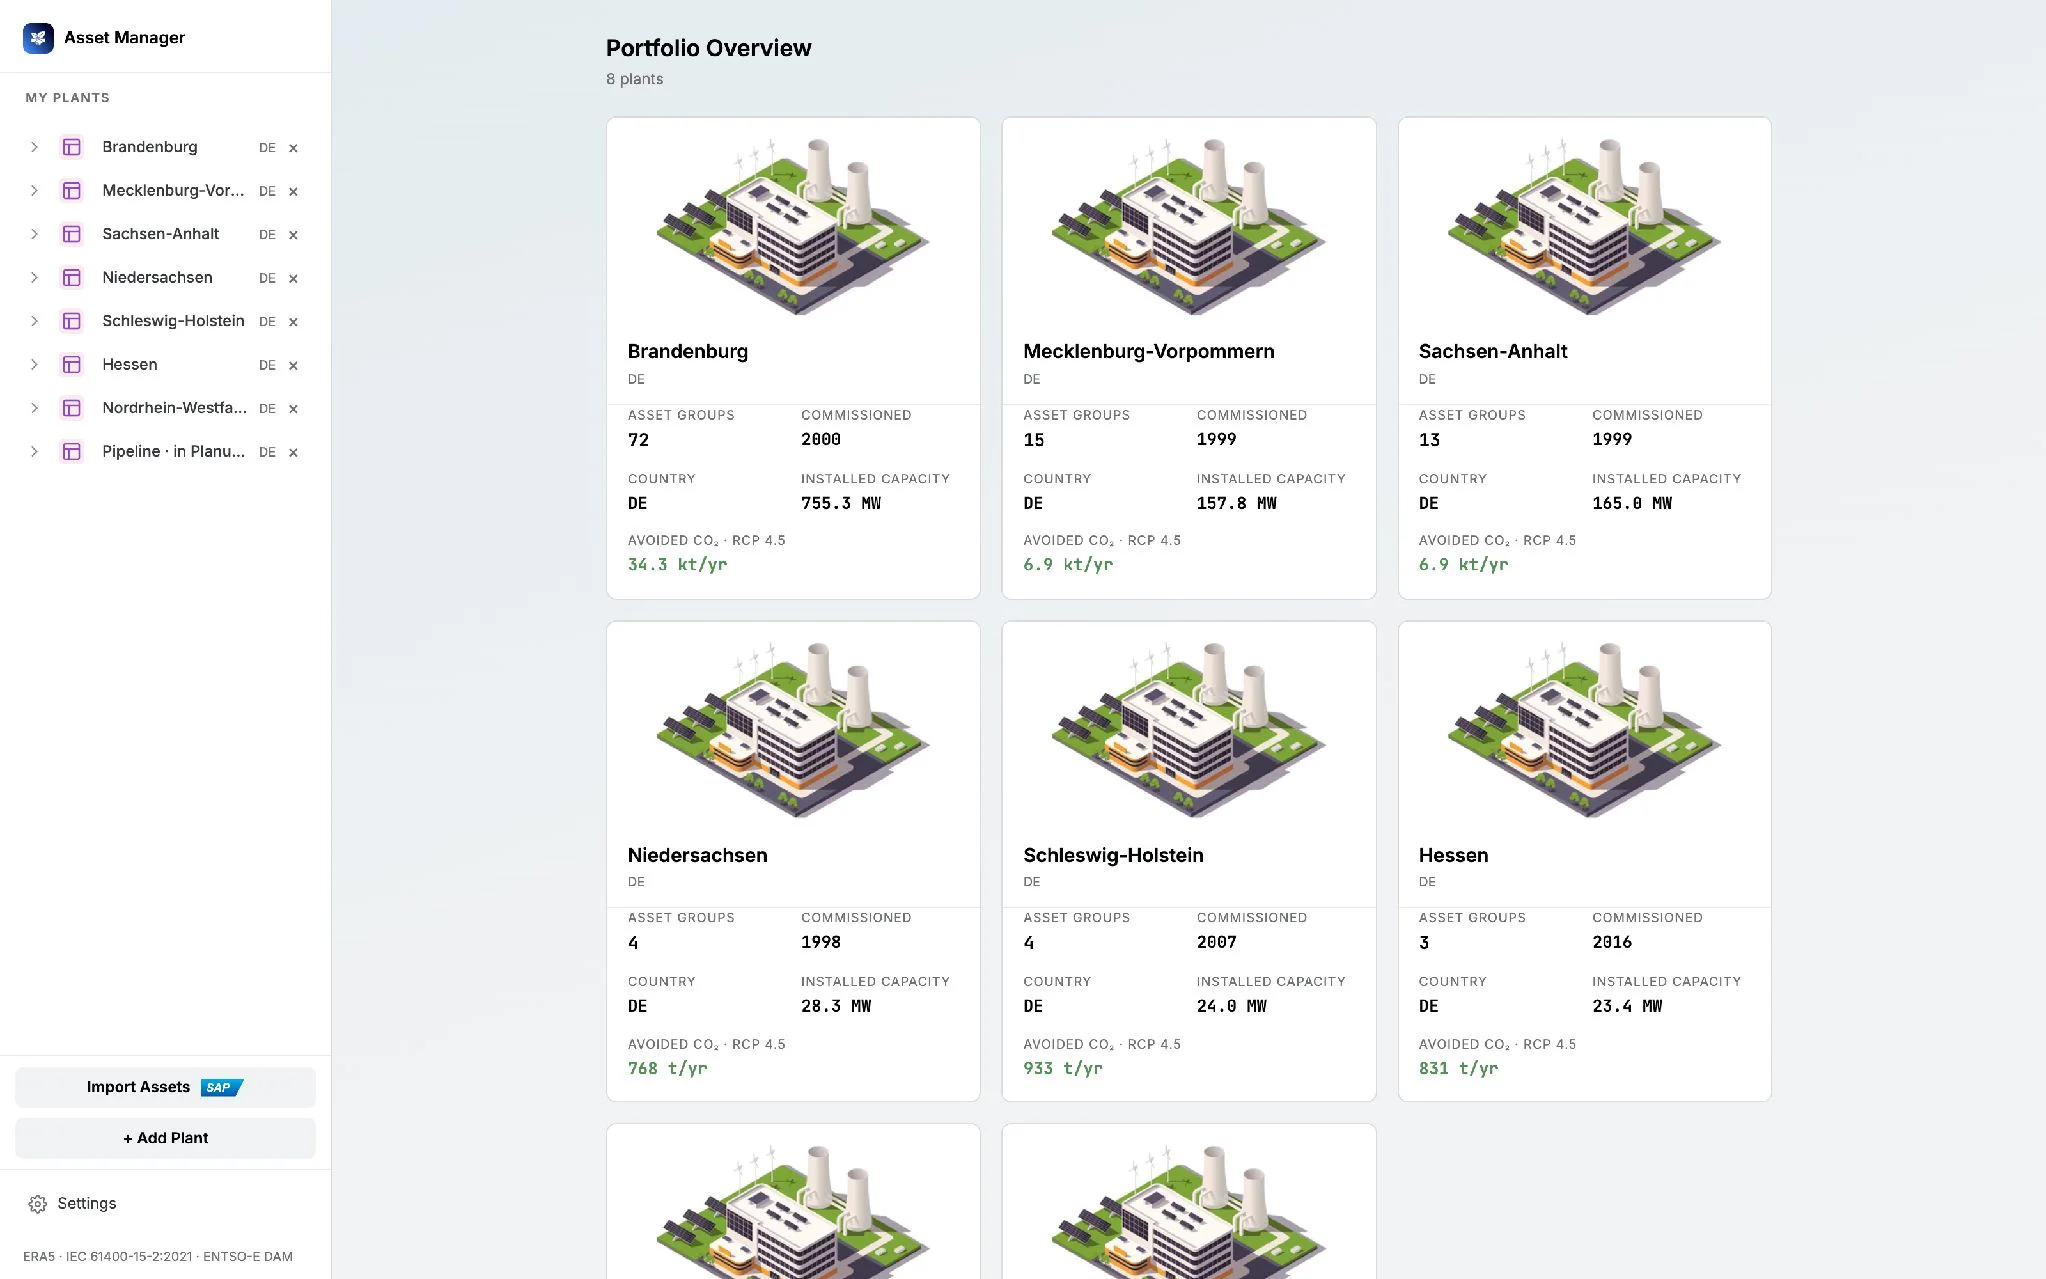
Platform preview. Illustrative portfolio, not customer results. Modelled approximate values.
Start with your asset list
Files in CSV, Excel, XML, JSON, PDF or ZIP format (up to 10 MB per upload), or an SAP export provide the starting point. Together, we review data, locations and assets and add technical and financial assumptions.
AI Importer
Optional AI assistant: it reads uploaded files and searches the MaStR registry live by SEE, SEL, EEG or ABR number, name, park, operator or postcode. It proposes an import. Data is written only after you click Import.
The AI Importer uses Anthropic Claude and processes data outside the EU. It requests explicit consent before first use. The platform runs on servers in Frankfurt (AWS eu-central-1).
Onboarding is file-based. Existing operating records enrich the assessment; data gaps and assumptions are made explicit.
Equipment specifications
Locations, equipment types, power curves and component characteristics.
Performance records
Available yield and operating records provide context in the conversation. They are not imported automatically. In a pilot, we compare the model against them and separate shutdowns, site and weather.
Maintenance & availability
Maintenance history and downtime assumptions provide context in the conversation. They are not imported automatically.
Financial assumptions
EEG, PPA or day-ahead tariff, investment horizon and discount assumptions.
Yield models
A model for the specific site
Equipment specifications meet hourly weather for the last 20 complete years via Open-Meteo: ERA5 through 2016, a finer weather model from 2017. Technical models translate weather into wind and solar yield.
Wind
Yield per turbine from hourly site weather and its power curve. About 900 turbine models are catalogued. Wind is extrapolated to hub height across the rotor. Results include a loss waterfall and P90/P50/P10 bands. Losses and uncertainties follow the structure of FGW TR 6, but this is explicitly not a TR 6 yield assessment. Without a site visit, local wind measurements or wind-field modelling, results are approximate values.
Solar
The pvlib/PVWatts model chain uses hourly irradiance and temperature. It covers soiling, temperature derating, inverter clipping and degradation.
Battery storage
Assessed through the risk and measures register: thermal derating and cycle ageing. No separate physical yield model.
Grid connections
Assessed through the risk and measures register: transformer derating and wildfire. No separate physical yield model.
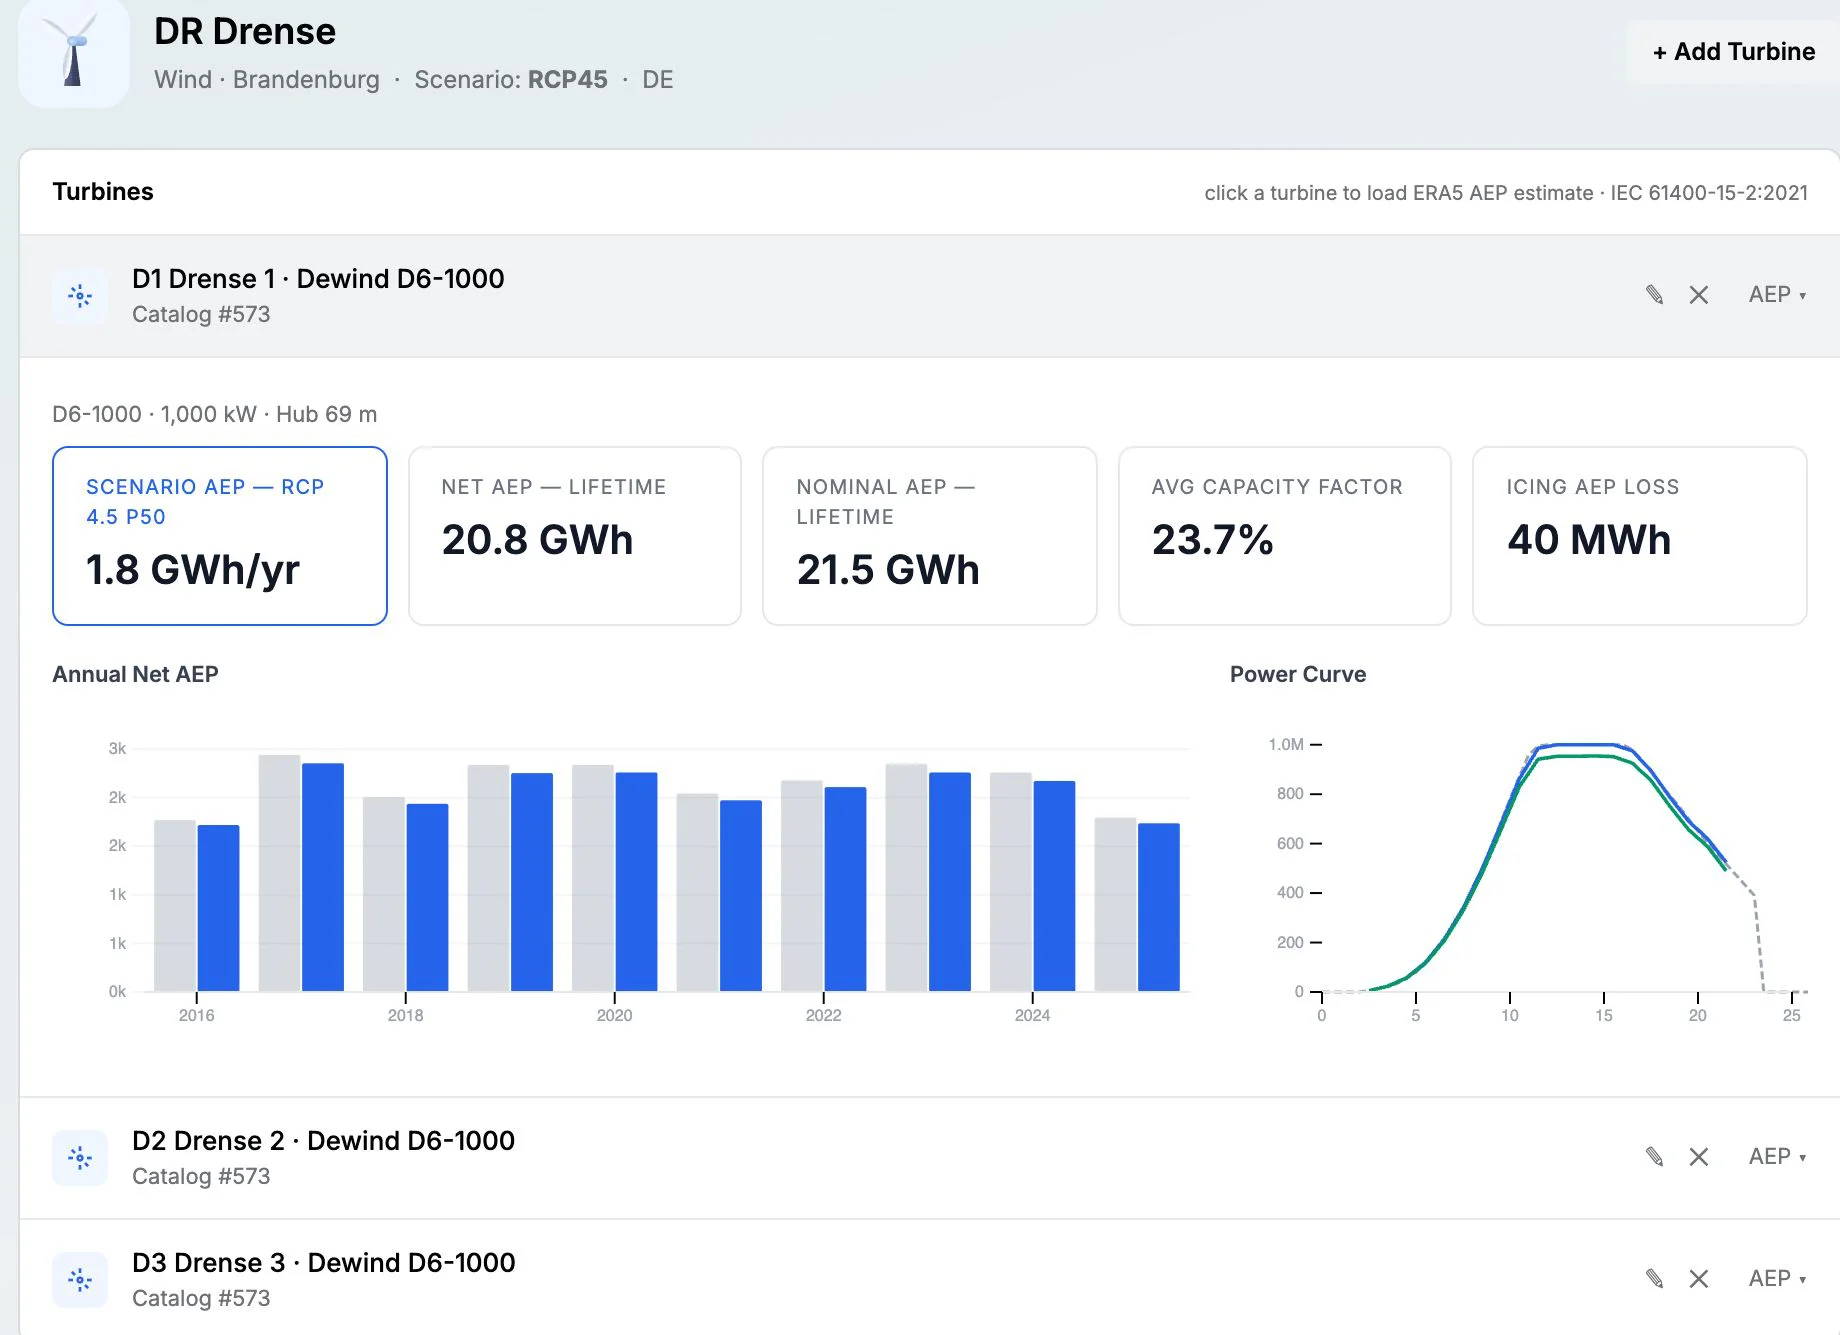
Platform preview. Illustrative portfolio, not customer results. Modelled approximate values.
Baseline & scenarios
Scenarios, not false certainty
Data provenance, tagged assumptions and uncertainty belong in the result. Compare historical conditions and possible climate pathways on a traceable basis.
Historical site weather baseline
Hourly site data for the last 20 complete years via the Open-Meteo archive. Through 2016: ERA5 reanalysis. From 2017: a finer-resolution weather model. The data describes historical conditions, not a promise of future production.
Energy projections
EURO-CORDEX at roughly 25 km resolution shows site capacity factor shifts. RCP denotes an emissions scenario: 2.6 = low, 4.5 = intermediate, 8.5 = high.
Uncertainty bands
P50 is the median modelled yield. P90/P10 show the lower and upper range: values exceeded with 90% and 10% probability respectively. Interpret them with their scenario, weather baseline and assumptions. No promised forecast.
Compare options in euros
Continued operation, repowering or a retrofit: the risk register links risks such as icing, lightning, hail, extreme wind, component fatigue and rotor ageing to measures, up to repowering. Each option is valued at your EEG tariff, PPA contract price or hourly day-ahead price (ENTSO-E).
Exposure
Site weather and physical hazards
Technical effect
Component stress and operating limits
Yield change
Losses, downtime and potential recovery
Mitigation
Technical and operational options
Financial value
Tariff, avoided losses and payback
Which option fits the asset?
- Continued operation of today's turbines or repowering with modern turbines at the same site.
- Rotor upgrades, lightning-protection upgrades, blade de-icing and condition-based maintenance.
- Recoverable yield, annual financial value, payback and avoided losses.
Compare on the same decision basis
The comparison uses your EEG, PPA or day-ahead tariff, investment horizon and discount assumptions. This makes technical options financially comparable.
Whether retrofit or repowering makes sense depends on your price and costs. We calculate it together with your data. Planning estimates are not quotes or promised savings. Not a certified yield assessment, not a TR 6 assessment and not financial or investment advice.
Grid
The map shows assets, transmission lines of 220 kV and above, the power-plant fleet, substations as connection points in Germany, modelled congestion, flood zones and weather. Shared grid connections are part of the portfolio structure.
Congestion: simulated hourly feed-in per substation of 100 kV and above from registered wind assets and solar parks of 1 MW and above. Transformer capacity is assumed by voltage class. A model from public data, not operator data.
For an existing wind park, we calculate on request how much PV fits on the existing grid connection, how often the connection is then full and how much energy would be curtailed.
On request, we analyse additional PV or wind capacity on flexible connections: at most 2 / 5 / 10% energy loss from curtailment, P50/P90 across 2017–2025 and 20 years ahead under RCP 4.5. This analysis is not yet in the platform interface.
More for grid operators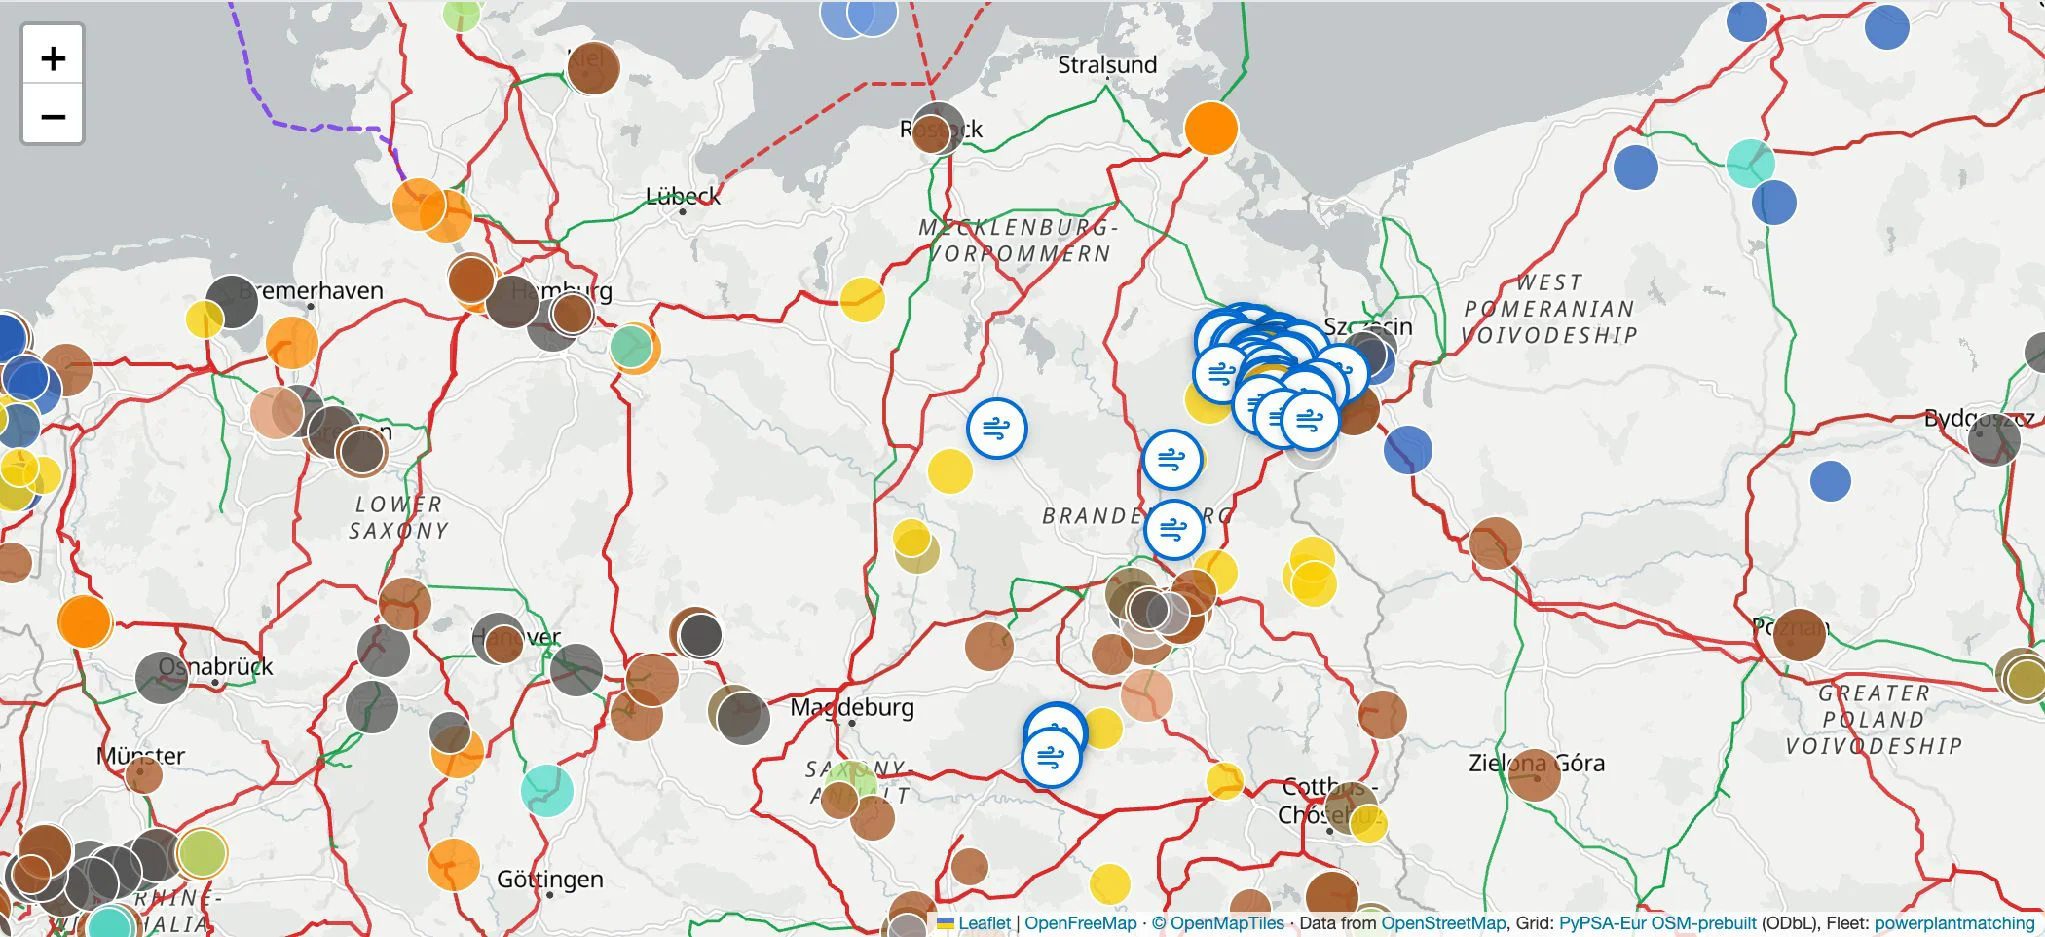
Platform preview. Illustrative portfolio, not customer results. Modelled approximate values.
Coverage
Weather, climate projections and physical hazard layers serve different purposes. Datasets have different spatial and temporal coverage, not uniform resolution or global coverage.
Weather & climate projections
More than 30 European countries. Hourly site weather and EURO-CORDEX projections serve different purposes.
Germany only
MaStR import, substations and connection points, congestion, flexible-connection headroom, regional flood zones, snow load and EEG tariffs.
Physical risks per asset
Flood zone, wildfire, hottest day of the year and snow load in Germany. The risk register also links icing, lightning, hail, extreme wind, component fatigue and rotor ageing to measures.
APIs
Climate API: hazard data across Europe, public documentation, from €200 per month plus VAT.
Energy API: with an API key on request. Turbine catalogue, turbine annual energy production (AEP) and wind climate shift. We discuss which access fits your workflow.
Climate API documentationLet’s talk about your site
30 minutes, online. When booking, name a park, a MaStR registry number or a substation, or send an asset list in advance. In the call, we show you with numbers which options exist there. Afterwards you decide whether a pilot makes sense.